This section offers visual information at a glance covering data on youth and women’s participation in politics among other topics, information on IPU activities and the work of different committees.
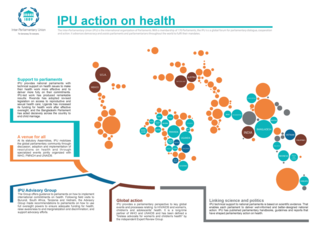
- ImpactWe help parliaments to become greener and to implement the Paris agreement.We support democracy by strengthening parliamentsWe work to increase women’s representation in parliament and empower women MPs.We defend the human rights of parliamentarians and help them uphold the rights of all.We help parliaments fight terrorism, cyber warfare and the proliferation of weapons of mass destruction.We encourage youth participation in parliaments and empower young MPs.We support parliaments in implementing the SDGs with a particular focus on health and climate change.
- Parliaments
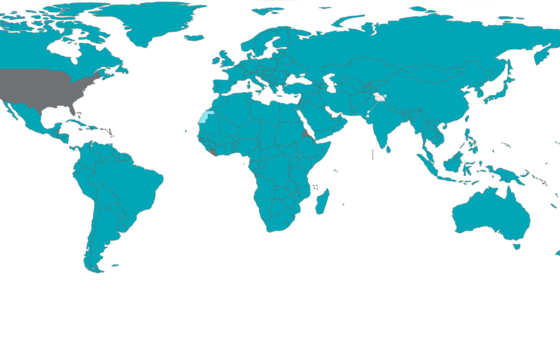 Nearly every country in the world has some form of parliament. Parliamentary systems fall into two categories: bicameral and unicameral. Out of 190 national parliaments in the world, 78 are bicameral (156 chambers) and 112 are unicameral, making a total of 268 chambers of parliament with some 44,000 members of parliament. IPU membership is made up of 180 national parliaments
Find a national parliament
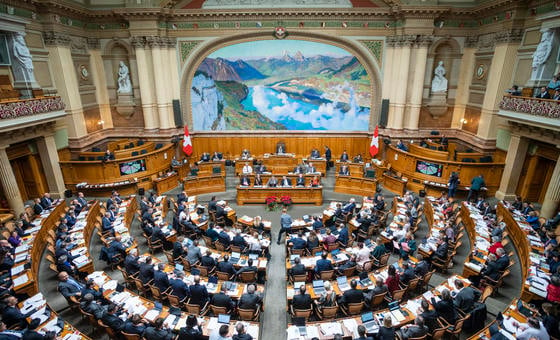
The Swiss National Council © The Swiss Parliament
We help strengthen parliaments to make them more representative and effective. - Knowledge
Discover the IPU's resources
Our library of essential resources for parliamentsGlobal data for and about national parliamentsLatest data and reports about women in parliamentResolutions, declarations and outcomes adopted by IPU MembersRecent innovations in the way parliaments workThe latest climate change legislation from the London School of Economics' databaseIPU on air- Conversations about parliamentary action